The evidence
Newer cards do more for less mana, in numbers large enough to speed up games and make them less fun and less strategic. What we found in our analysis: the best cards are no stronger than they were thirty years ago. Instead, there is widespread power creep in recent sets among middle-tier cards. This is why Vulcan Highlander assigns points to many cards and puts a cap on how many points a deck can have. Nearly half of all pointed cards were first printed 2019 or later. For example, Bloomburrow's 40th-best card sees more play than Zendikar's 20th-best does.
How much of a set is worth playing?
Looking at all of the card sets in Magic's history, how much of each set do Commander players actually use? Our data is drawn from EDHREC's catalog of published deck lists. A deck is eligible to run a card when it meets that card's color requirements (i.e. a white card is measured against decks that include white, not against every deck). We count a card as "played" when at least 0.5% of its eligible decks actually run it. Looking at a representative sample of sets over the past 30 years, we found that 5.2% of Ice Age cards are in eligible decks, while 43.6% of Bloomburrow cards are.
The easy objection: people just like new cards. EDHREC's data includes only a rolling window of the past two years, and people naturally like to brew with new cards when a set is released. Let's take a look at why there's more to it than that.
Power creep is happening in middle-tier cards, not the top
The cards Commander players actually reach for most are not the new ones. These are the ten most-played nonland cards in the format, and their popularity is not correlated with age: three from 1993, six between 2003 and 2011, and one from 2019 (see the methodology page to understand how we measure play). Note that each share counts only the decks that could run the card, so Swords to Plowshares is measured against decks that include white, and a colorless card against nearly every deck. Sol Ring still leads after thirty-three years, and the card that comes closest to it is Arcane Signet (another strong mana rock), printed 26 years later. Every one of the ten costs 1 point in Vulcan Highlander. This demonstrates that there's still plenty of interest in older cards as long as they are competitive in Commander currently.
The play rates behind the most-played chart
| Card | First printed | Eligible decks playing it |
|---|---|---|
| Sol Ring | 1993 | 83.3% |
| Swords to Plowshares | 1993 | 60.7% |
| Counterspell | 1993 | 41.9% |
| Talisman of Dominance | 2003 | 32.1% |
| Farseek | 2005 | 35.8% |
| Path to Exile | 2009 | 47.4% |
| Cultivate | 2010 | 41.8% |
| Blasphemous Act | 2011 | 33.6% |
| Beast Within | 2011 | 32.8% |
| Arcane Signet | 2019 | 71.9% |
Where we find the power creep is deeper in the pool of each new set. To illustrate this, we looked at how frequently the 40th best card in each set is played in Commander decks currently. There's no real trend in sets up to 2016, then a modest but noticeable increase through 2023, and then a big jump in sets since then. Bloomburrow's 40th-best card sees more play than Zendikar's 20th-best does. This is power creep: not a rising ceiling with a few new bombs to ban, but a deeper pool that lets every deck fill more slots with strong cards. This is why Vulcan Highlander uses points instead of a ban list. One power crept middle-tier card in a deck won't dramatically affect game play, but dozens of them will.
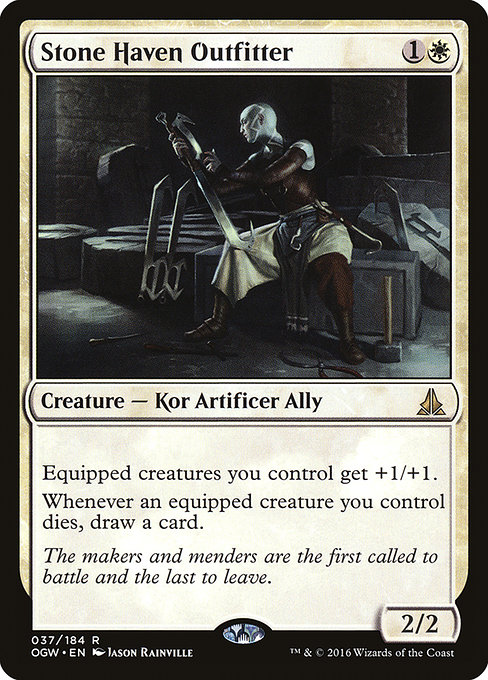
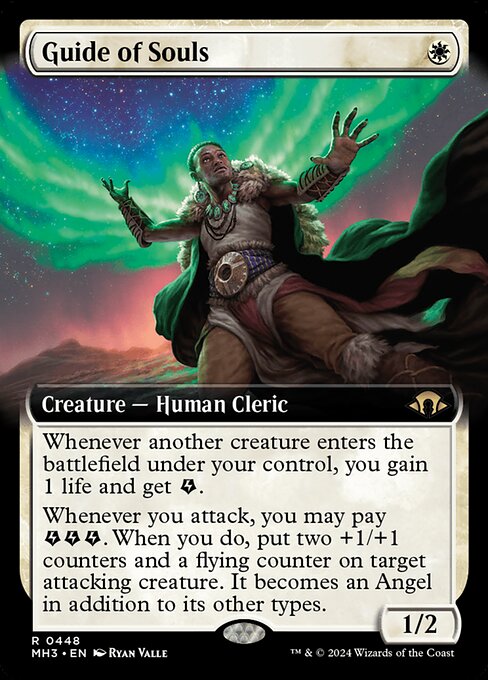
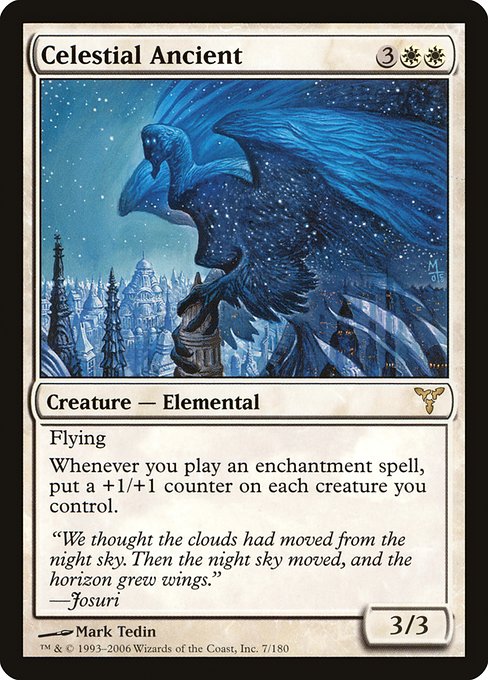
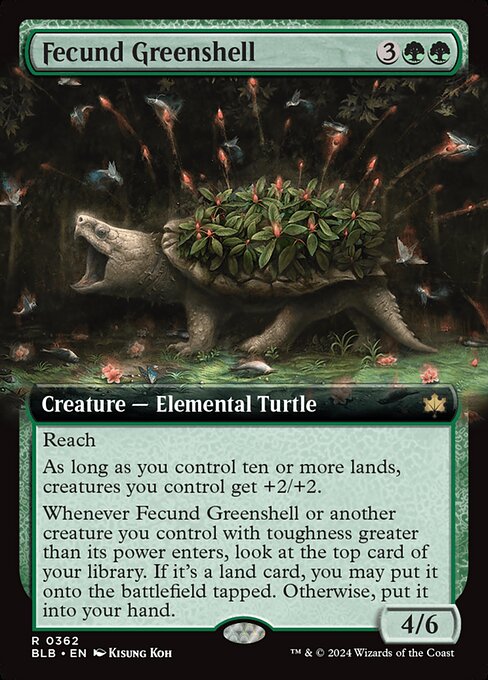
Here is what that looks like in cards rather than percentages. These are two side-by-side comparisons of cards from between 38th - 43rd place in older sets vs new sets. To make the comparisons feel like apples-to-apples, we looked for cards that met specific criteria: rare cards (which are routinely played in Commander), non-legendary creatures, and similar mana costs. The older cards are rarely played while their newer counterparts earn real deck slots. These are comparisons of typical cards, not cherry-picked exceptions.
The play rates behind the 40th-best chart
| Set | Best card | 5th-best | 10th-best | 20th-best | 40th-best |
|---|---|---|---|---|---|
| Ice Age 1995 | 31.5% | 5.5% | 2.5% | 0.38% | 0.08% |
| Mirrodin 2003 | 32.1% | 11.8% | 5.4% | 1.7% | 0.53% |
| Zendikar 2009 | 7.6% | 5.0% | 2.8% | 1.2% | 0.38% |
| Khans of Tarkir 2014 | 15.1% | 5.8% | 4.3% | 1.9% | 0.60% |
| Kaladesh 2016 | 7.0% | 3.9% | 3.0% | 1.2% | 0.45% |
| Dominaria 2018 | 11.7% | 4.6% | 2.8% | 1.6% | 0.68% |
| Theros Beyond Death 2020 | 7.9% | 3.5% | 3.1% | 1.6% | 0.76% |
| March of the Machine 2023 | 7.5% | 4.5% | 3.4% | 1.8% | 0.90% |
| Modern Horizons 3 2024 | 10.5% | 6.3% | 5.6% | 4.3% | 2.3% |
| Bloomburrow 2024 | 6.9% | 4.3% | 3.2% | 2.0% | 1.3% |
| Secrets of Strixhaven 2026 | 9.9% | 4.6% | 3.3% | 2.7% | 1.8% |
Where the pointed cards come from
This chart shows what share of each year's cards costs more than zero points. Three regimes are apparent in the data.
1993–1999, the broken era. The highest pointing rates in the chart, and 21 of the 48 most expensive cards: the dual lands, the tutors, Mana Vault. An overpowered card costs points in Vulcan Highlander no matter its age.
2000–2018, the fair era. Almost two decades where the percentage of pointed cards is locked between 2% and 9%, with few cards exceeding 1 point. This is the power level the Vulcan Highlander point budget is calibrated to.
2019 onward, the creep era. In 2019 the rate for pointed cards starts to rise, and has stayed elevated since. 2023 at 11.5% is the highest rate of any year since 1999. Our formula - informed by nothing more than price and popularity - matches players' gaming experience with power creep. Nearly half of all pointed cards were first printed 2019 or later.
Why 2025 and 2026 aren't counted yet. EDHREC counts decks over a rolling two-year window, so cards from 2025 and 2026 inherently appear in fewer decks. Their play rate looks lower only because they're new, not because players passed on them. Once we're 18 months past the end of a recent year, we'll count it, as the numbers start to settle by then.
Note that a card being worth playing doesn't mean it has to cost more than 0 points. The first chart on this page shows 43.6% of Bloomburrow earning deck slots — that's 109 cards, and only 25 of them cost points; the other 84 are free. So playing Vulcan Highlander doesn't mean giving up on new sets. It means the point budget nudges you past the handful of pushed cards everyone plays, and into the rest of what a set has to offer.
The full table
| Year | Cards printed | Cards costing points | Rate |
|---|---|---|---|
| 1993 | 347 | 74 | 21.3% |
| 1994 | 608 | 87 | 14.3% |
| 1995 | 460 | 17 | 3.7% |
| 1996 | 466 | 23 | 4.9% |
| 1997 | 775 | 54 | 7.0% |
| 1998 | 693 | 53 | 7.6% |
| 1999 | 765 | 95 | 12.4% |
| 2000 | 596 | 18 | 3.0% |
| 2001 | 606 | 12 | 2.0% |
| 2002 | 602 | 25 | 4.2% |
| 2003 | 556 | 37 | 6.7% |
| 2004 | 606 | 56 | 9.2% |
| 2005 | 649 | 33 | 5.1% |
| 2006 | 730 | 38 | 5.2% |
| 2007 | 620 | 39 | 6.3% |
| 2008 | 825 | 42 | 5.1% |
| 2009 | 618 | 37 | 6.0% |
| 2010 | 687 | 54 | 7.9% |
| 2011 | 693 | 56 | 8.1% |
| 2012 | 728 | 37 | 5.1% |
| 2013 | 753 | 40 | 5.3% |
| 2014 | 808 | 40 | 5.0% |
| 2015 | 863 | 36 | 4.2% |
| 2016 | 1,009 | 36 | 3.6% |
| 2017 | 913 | 44 | 4.8% |
| 2018 | 1,008 | 49 | 4.9% |
| 2019 | 1,205 | 89 | 7.4% |
| 2020 | 1,201 | 103 | 8.6% |
| 2021 | 1,820 | 125 | 6.9% |
| 2022 | 1,929 | 189 | 9.8% |
| 2023 | 1,923 | 222 | 11.5% |
| 2024 | 2,061 | 206 | 10.0% |
| 2025 | 1,929 | 123 | 6.4% |
| 2026 | 1,506 | 44 | 2.9% |